Plot Coordinates from a CSV File on the Map
Data is almost always anchored to a specific place. Whether it is a collection of environmental sensor readings, customer delivery addresses from a CRM export, or real estate property locations, geographic coordinates form the backbone of modern operations — yet turning a raw spreadsheet into a visual map was historically a frustrating technical task requiring expensive desktop GIS software, manual projection setup, and hours of configuration.
This free lat/long plotter removes that barrier entirely. Upload a CSV file with latitude and longitude columns — the tool automatically detects the coordinate fields using fuzzy header matching, plots all points on an interactive Leaflet map, and lets you explore each record by clicking its marker. Change point colour and size, switch between Street, Satellite, and Terrain basemaps, and export the entire dataset as GeoJSON with one click. Your file is processed entirely in the browser and never leaves your device.
Key Features
- Auto-detect Columns — automatically finds lat/lng columns named lat, latitude, lon, longitude, x, y, etc.
- CSV Upload — browse for a file or drag & drop it onto the map
- Point Colour Picker — change the colour of all plotted points with a single click
- Point Size Slider — adjust marker radius from 3 to 20 pixels
- Attribute Popups — click any point to see all CSV columns stored for that record
- Basemap Switcher — Street, Satellite (Esri), and Terrain map styles with automatic tile fallback
- Export as GeoJSON — download all plotted points as a .geojson file
- Fullscreen Mode — expand the map to fill the entire viewport
- 500-point limit — first 500 rows are shown; a notice is displayed if the file is larger
Lat / Long Plotter — Step by Step User Guide
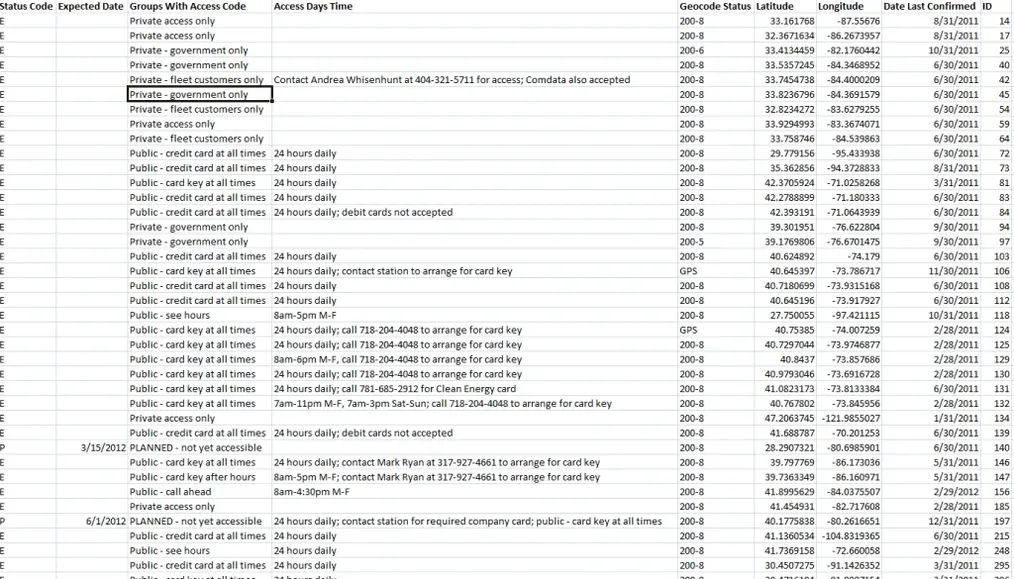
Step 1: Prepare your GPS coordinates CSV file
Your CSV data must have longitude and latitude in separate columns with appropriate column names (e.g. lat, latitude, lon, longitude). All other attribute columns should have their own headers. Below is a sample CSV structure:
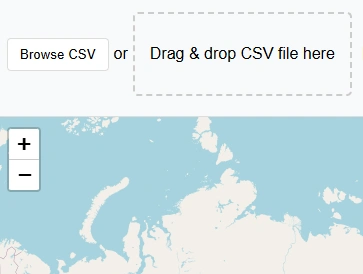
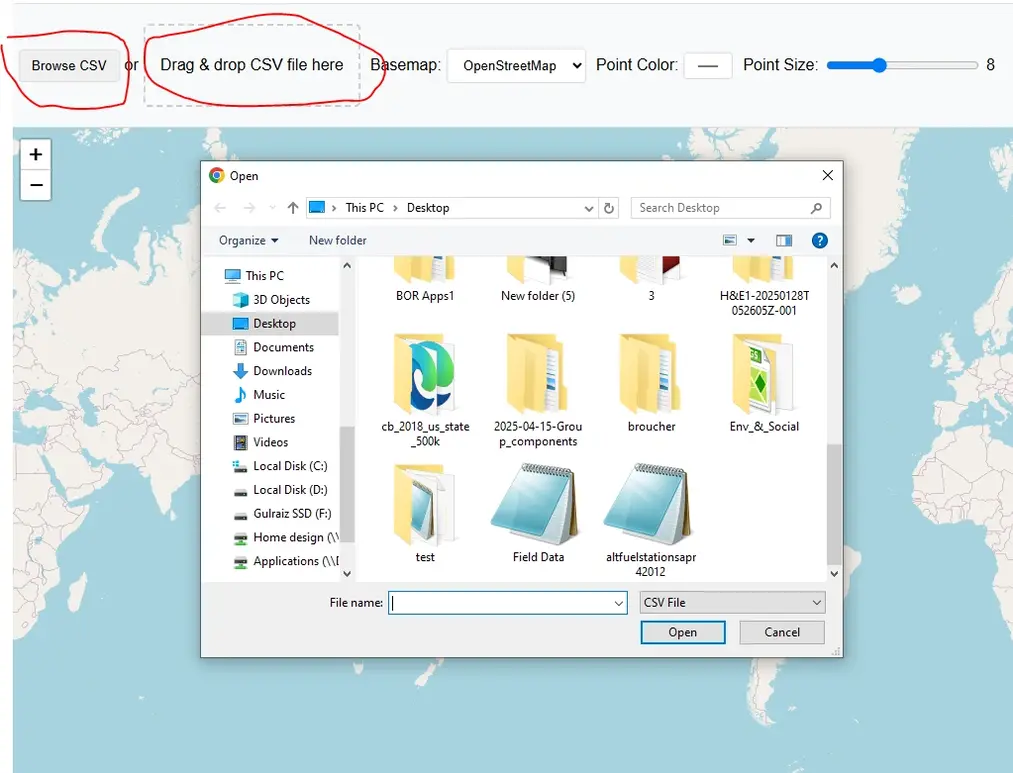
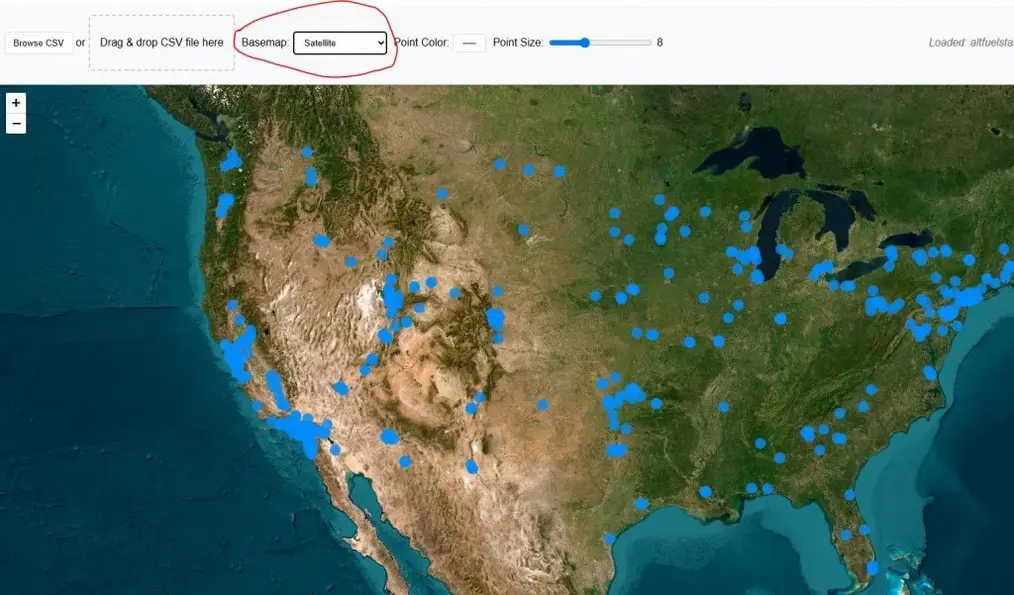
Step 2: Upload or Drag & Drop your CSV file
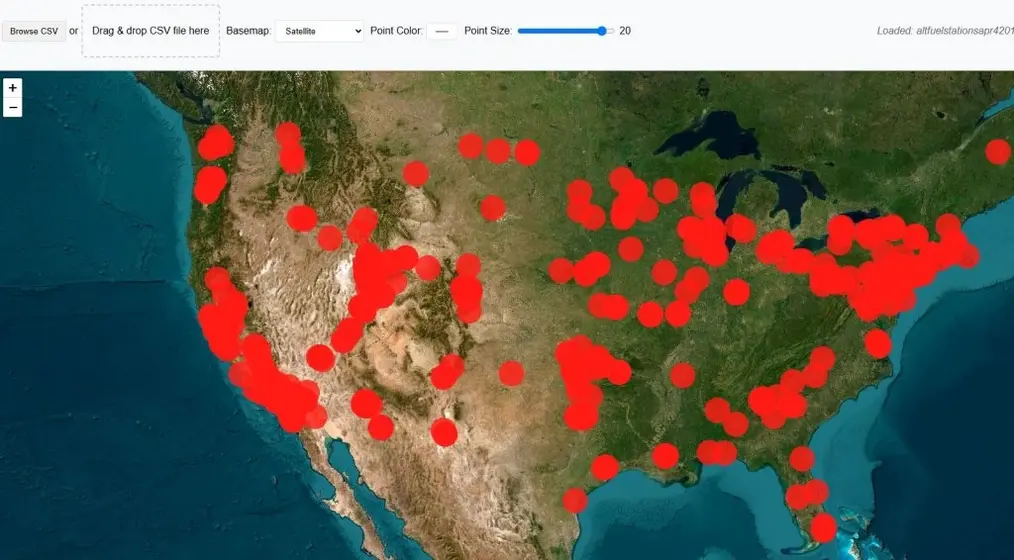
Click "Browse CSV" or drag & drop your file onto the map. The app automatically detects coordinate columns and loads all points immediately.
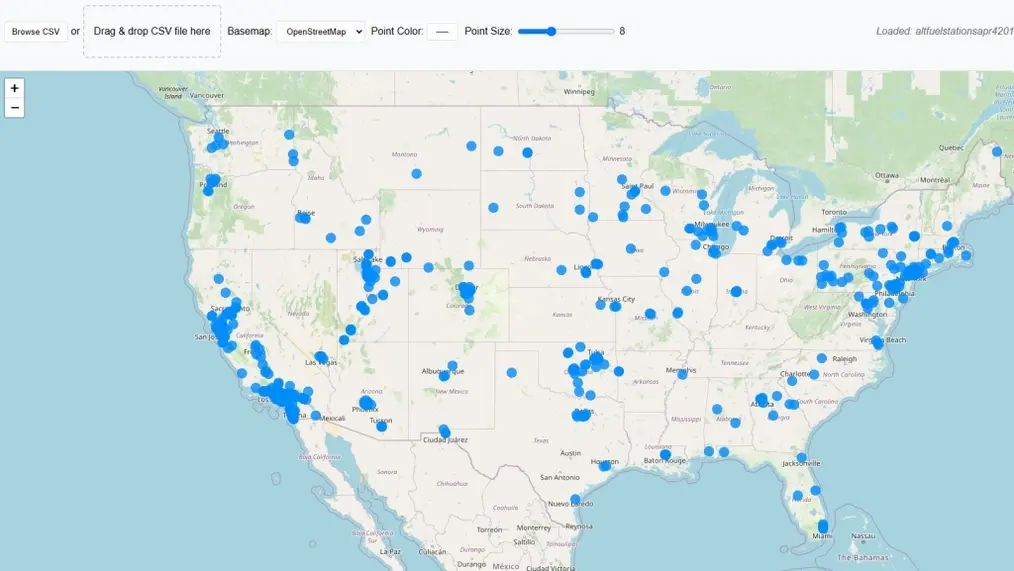
The application automatically detects coordinate data in the correct format and displays all points on the map. The map zooms to fit the full extent of your data.
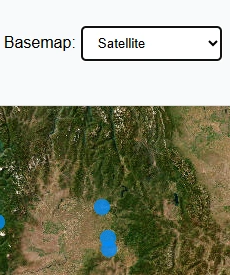
Step 3: Change the Basemap
The default basemap is Street view by OpenStreetMap. Switch to Satellite imagery to see your coordinate data against real-world aerial photography.
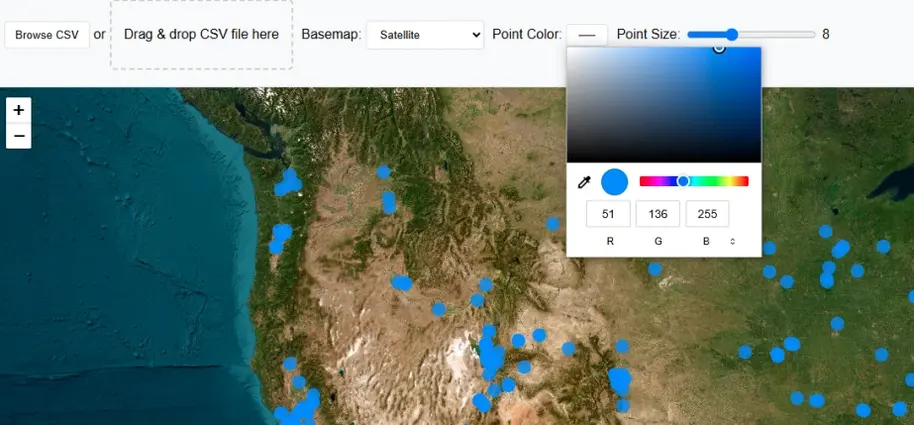
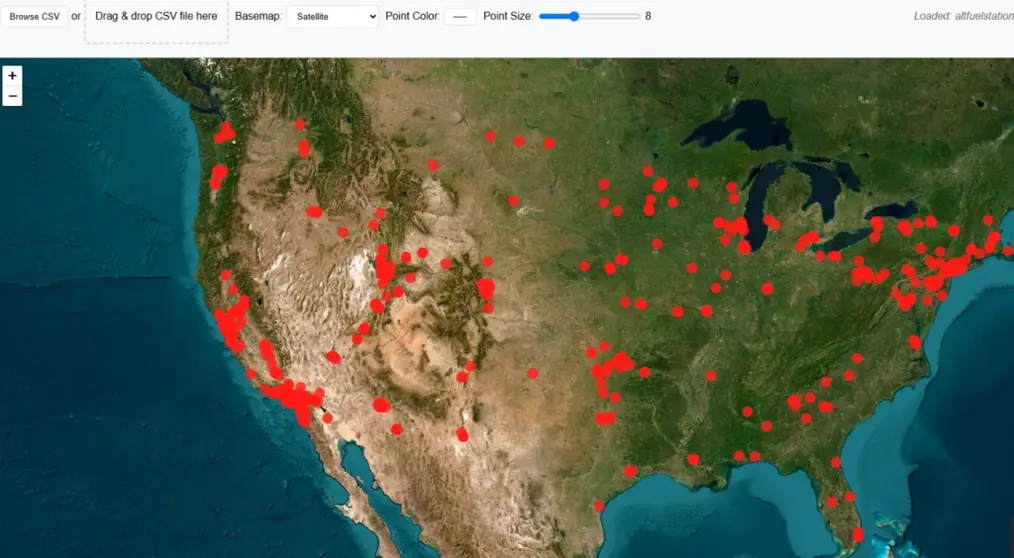
Step 4: Change the Point Colour
To make your map more readable, change the point colour using the colour picker in the toolbar. All plotted markers update instantly.
Step 5: Adjust the Point Size
Use the size slider to change the radius of all plotted points from 3 to 20 pixels.
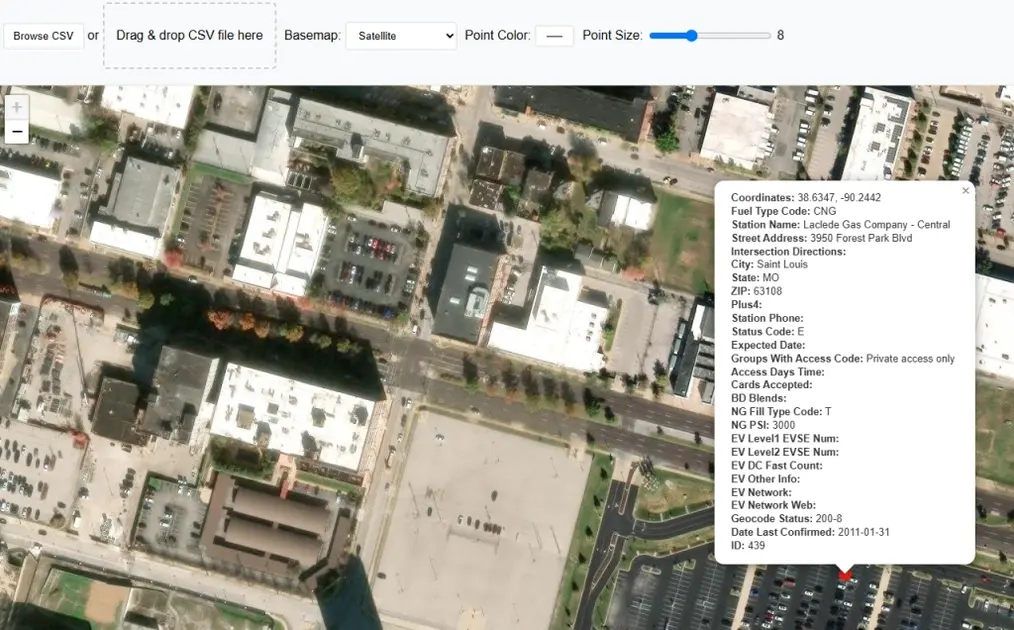
Step 6: Click a Point to View Attributes
Click any point on the map to open a popup window showing the stored attribute information for that record, along with its latitude and longitude values.
Who Can Benefit from This Tool?
The Mechanics of Spatial Ingestion
When you drop a CSV onto the tool, the parsing layer does not blindly read the text. A fuzzy column-matching algorithm scans the header row for common naming conventions — lat, latitude, lon, longitude, x, y, xcoord, ycoord — and extracts the decimal-degree coordinate values automatically. The entire transformation runs inside the browser:
Most interactive maps render on Web Mercator (EPSG:3857), while standard GPS devices and smartphones record coordinates in WGS 84 (EPSG:4326)decimal degrees. The tool handles this coordinate reference conversion automatically — you provide the raw latitude and longitude values and the points appear in the correct location, with no knowledge of cartography required.
Client-Side Processing and Data Privacy
Uploading data to a cloud mapping tool raises real security concerns. Sending proprietary customer addresses or sensitive research coordinates to an external server can conflict with data protection laws and corporate IT policy. This tool bypasses that risk entirely: CSV parsing runs 100% inside your browser using PapaParse. Your spreadsheet never travels over the internet.
To keep rendering fast on mobile devices and older hardware, the tool plots the first 500 rows of any file. Rendering thousands of interactive markers simultaneously can saturate browser memory; a clean cap at 500 points ensures that adjusting colour or size updates the map instantly without lag.
Interactivity and the GeoJSON Bridge
A map becomes genuinely useful when you can interrogate the data behind the points. Click any plotted marker and a popup opens showing every attribute column stored in the original CSV for that record — names, dates, IDs, status values, or whatever your spreadsheet contains. Switching to satellite or terrain basemaps adds immediate spatial context: an environmental scientist can instantly see whether a monitoring station sits inside a dense forest or an industrial zone; a logistics analyst can visually confirm a depot's position relative to road infrastructure.
Once visual exploration is complete, the Export as GeoJSON button bridges the gap between this lightweight tool and professional GIS platforms. The open GeoJSON standard is natively supported by QGIS, Mapbox, and GitHub — so your mapped points move seamlessly into any downstream spatial workflow.
Frequently Asked Questions
Open Source & Credits
- CSV parsing: PapaParse — MIT licence
- Map tiles: CARTO, OpenStreetMap, Esri
- Map library: Leaflet JS — open-source interactive mapping